PAM (Pulse Amplitude Modulation):
Pulse amplitude modulation (or PAM) is the essential form of pulse modulation. In this type of modulation, the signal or wave is sampled at fixed intervals and every sample is produced equivalent to the amplitude of the modulating signal or wave.
In the PAM (Pulse Amplitude Modulation) method, the amplitude of the carrier wave or signal alters, which is proportionate to the instant amplitude of the message wave or modulated signal. The PAM wave will reflect the amplitude of the initial wave, as the signal determines the way of the entire wave. In general Pulse Amplitude Modulation (PAM), a signal or wave sampled at Nyquist rate can be regenerated, bypassing it within an efficient Low Pass Filter (LPF) with accurate cutoff frequency and this is named as demodulation of PAM signal or wave. The code for PAM in MATLAB and its Simulink are given below:
clc;
clear all;
close all;
fc = input('Enter Carrier Frequency:');
fm = input('Enter Message Frequency:');
fs = 100*fc;
t = 0:1/fs:4/fm;
m = sin(2*pi*fm*t);
c = 0.5*square(2*pi*fc*t) + 0.5;
mo = m.*c;      		%Modulation of PAM
subplot(4,1,1);
plot(t,m);
xlabel('Time---->');
ylabel('Amplitude---->');
title('Message Signal');
grid on;
subplot(4,1,2);
plot(t,c);
xlabel('Time---->');
ylabel('Amplitude---->');
title('Carrier Signal');
grid on;
subplot(4,1,3);
plot(t,mo);
xlabel('Time---->');
ylabel('Amplitude---->');
title('PAM Signal');
grid on;
%Demodulation of PAM Signal
de = mo.*c;
filter = fir1(200,fm/fs,'low');
demo=conv(filter,de);			%Demodulated Signal
t1 = 0:1/(length(demo)-1):1;
subplot(4,1,4);
plot(t1,demo);
xlabel('Time---->');
ylabel('Amplitude---->');
title('Demodulated Signal');
grid on;
After running the above code, we give the frequencies to message and carrier signal on Command Window as follows:

Now after giving the frequencies the output of the above code is as follows:

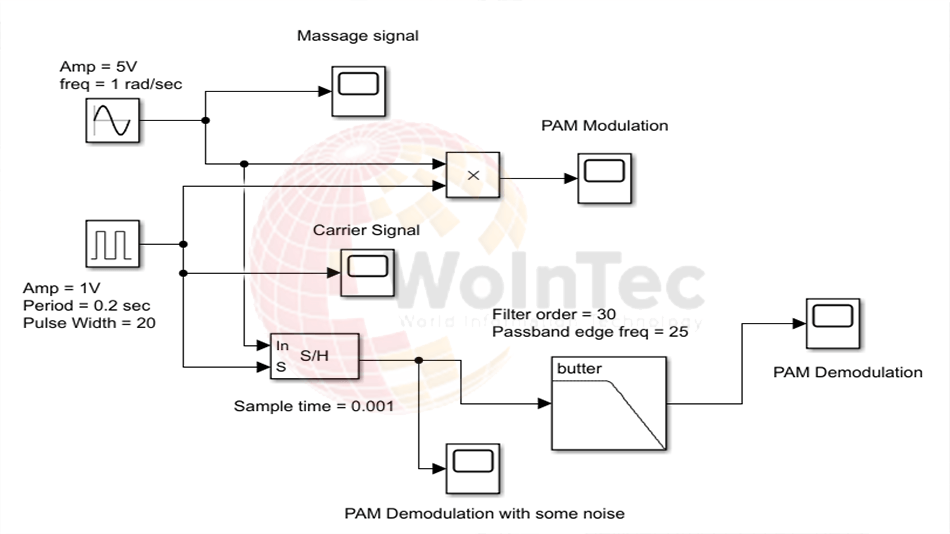
While in Simulink the block diagram of PAM is as follows: