Taking T = 0:0.05:10, Message = sin(2*pi*Fm*T), Carrier = sin(2*pi*Fc*T)
1. What is the Role of ‘T’ in the code? What would happen if we change the value of ‘T’? Try changing ‘T’ to 1/10, 1/20,1/30,1/50,1/100. Explain what happens as you decrease the value of ‘T’?
Solution:
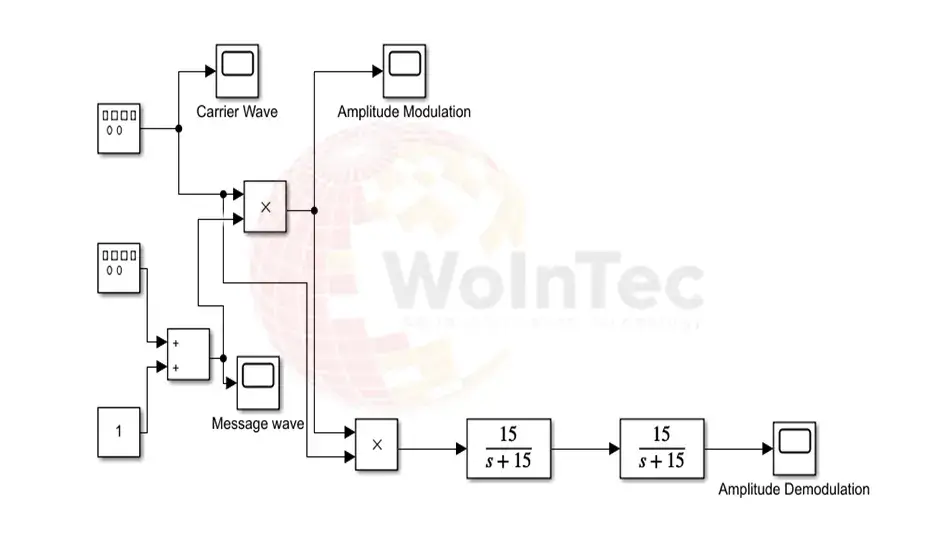
Before checking that “What would happen if we change the value of ‘T’.”, in Amplitude Modulation and Demodulation, we write the program first as given below:
Program:
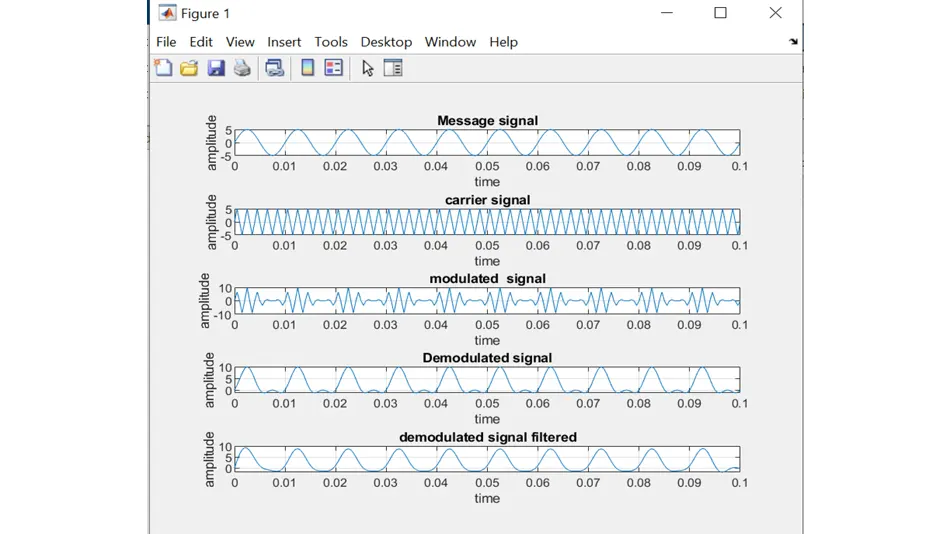
% Amplitude Modulation and Demodulation:
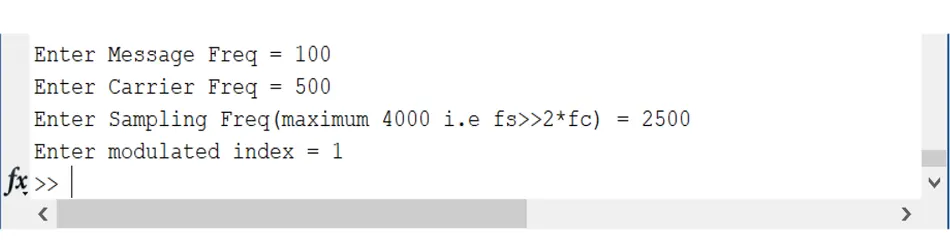
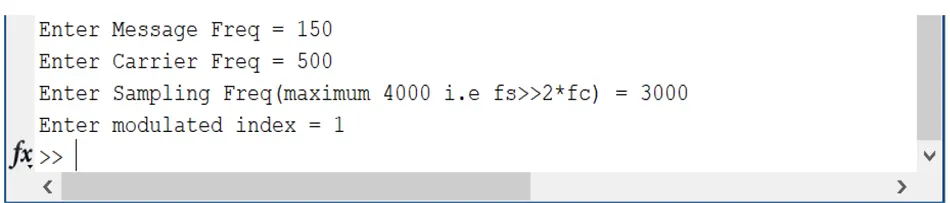
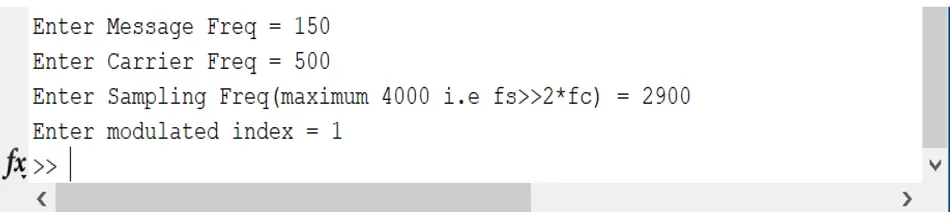
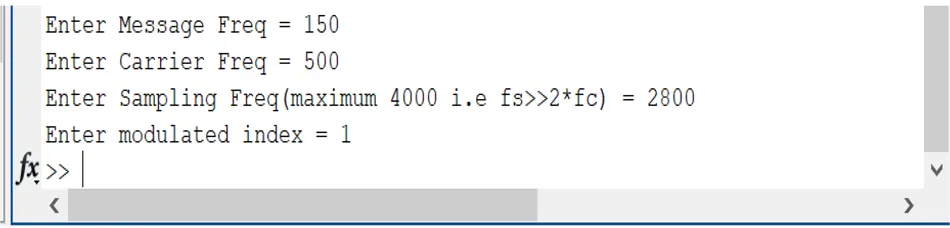
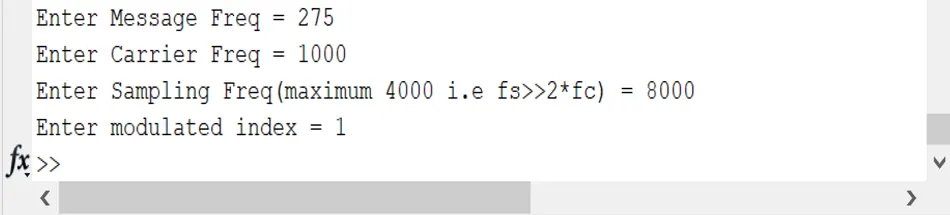
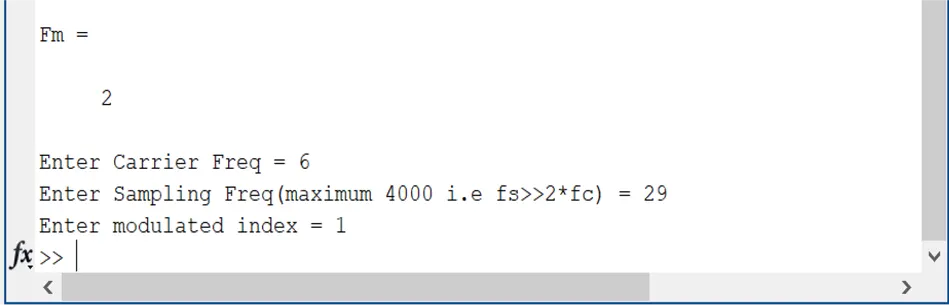
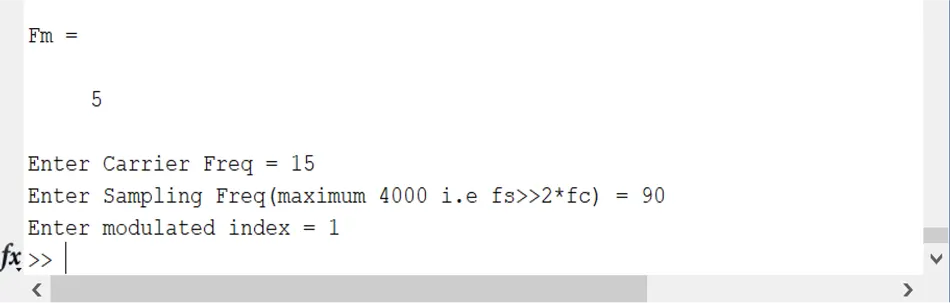
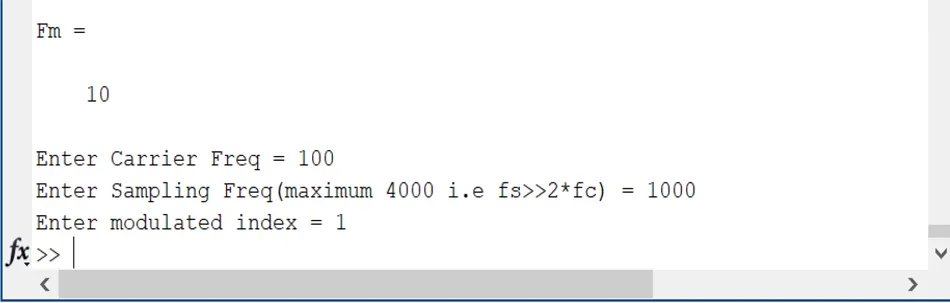
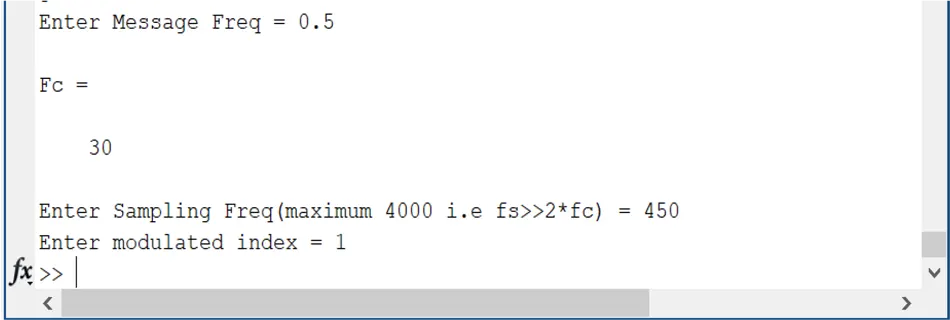
Fm=input('Enter Message Freq = ');
Fc=input('Enter Carrier Freq = ');
Fs=input('Enter Sampling Freq(maximum 4000 i.e fs>>2*fc) = ');
mi=input('Enter modulated index = ');
T = 0:0.05:10;
% time according to given scenario (means no change in time in this code):
a=5;
Message = a*sin(2*pi*Fm*T);
Carrier = a*sin(2*pi*Fc*T);
modulation=(a+mi*Message).*sin(2*pi*Fc*T);
[num,den]=butter(10,1.2*Fc/Fs);
%demodulated signal with noise:
sdem = amdemod(modulation,Fc,Fs);
%filtered demodulated signal:
sfil = amdemod(modulation,Fc,Fs,0,0,num,den);
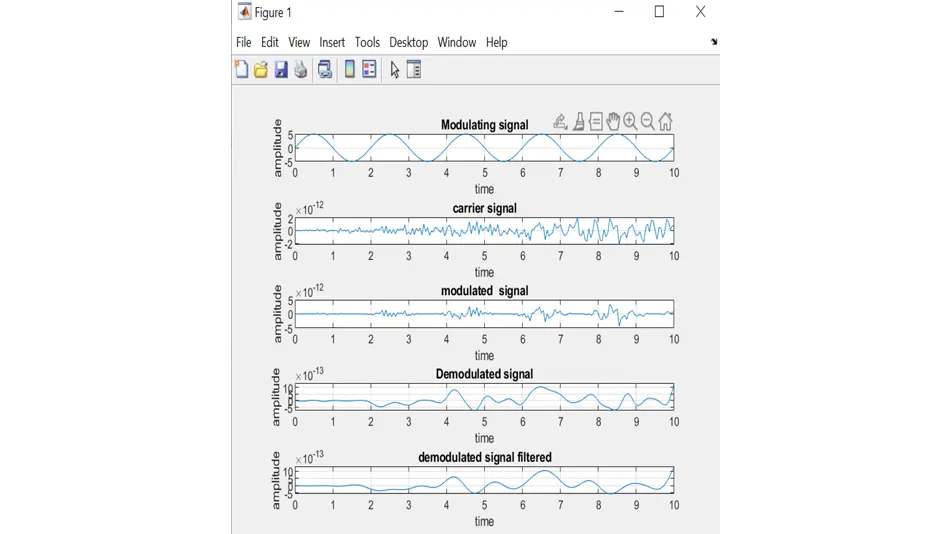
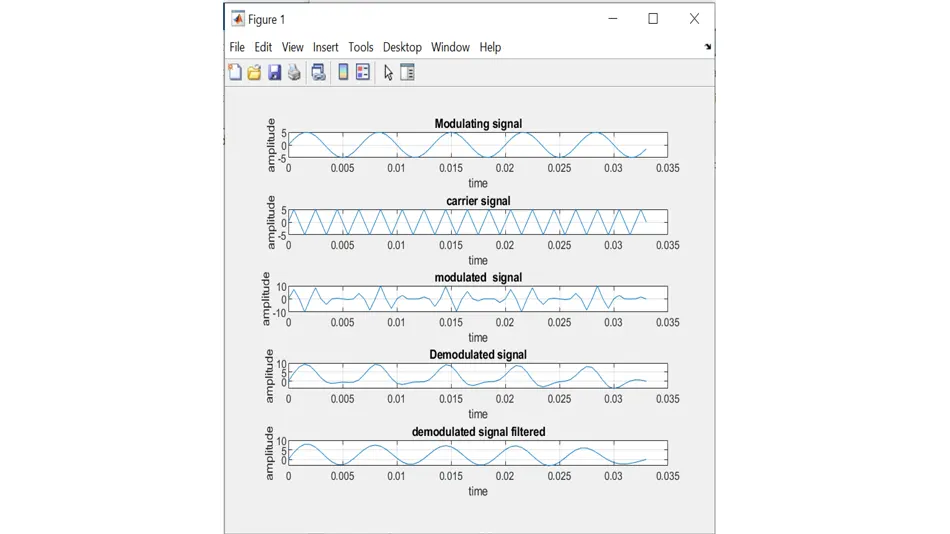
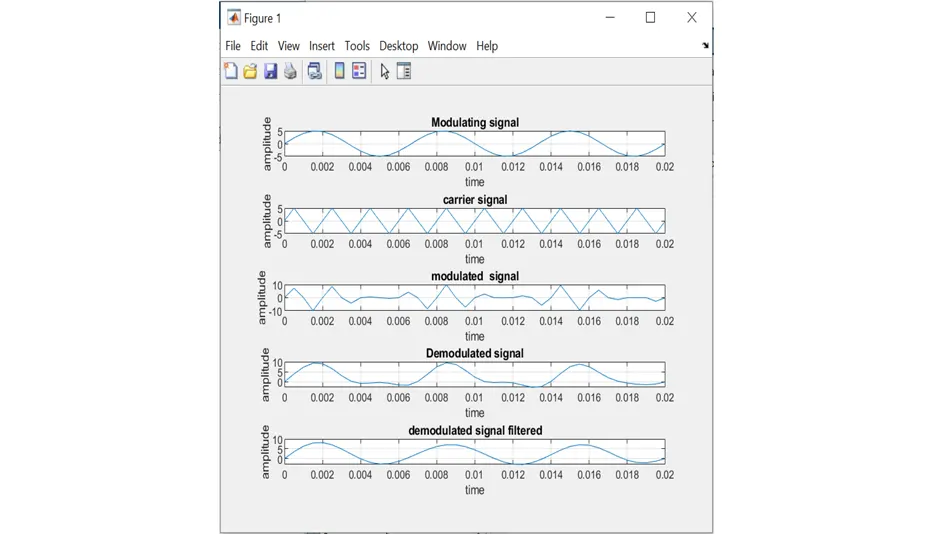
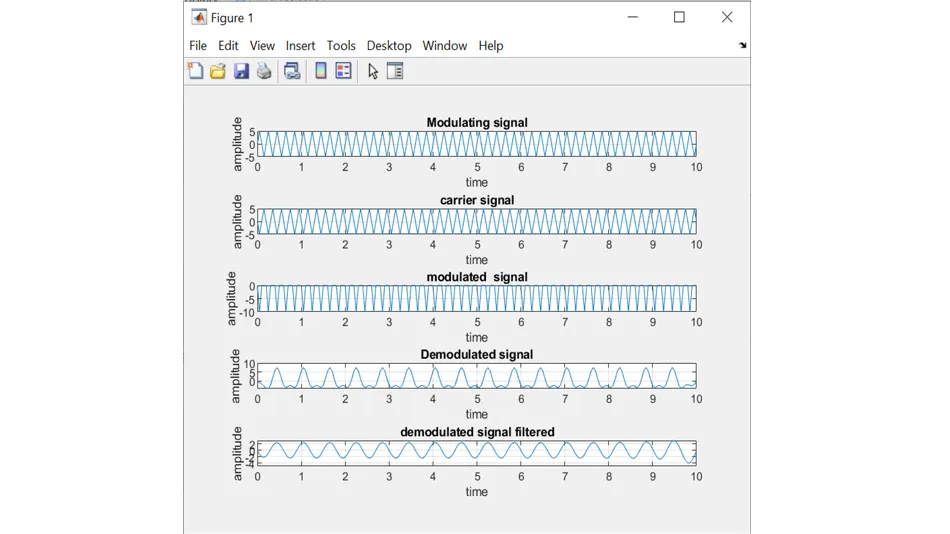
subplot(5,1,1);
plot(T,Message);
title('Modulating signal');
xlabel('time');
ylabel('amplitude');
grid on
subplot(5,1,2);
plot(T,Carrier);
title('carreie signal signal');
xlabel('time');
ylabel('amplitude');
grid on
subplot(5,1,3);
plot(T,modulation);
title('modulated signal');
xlabel('time');
ylabel('amplitude');
grid on
subplot(5,1,4);
plot(T,sdem);
title('Demodulated signal');
xlabel('time');
ylabel('amplitude');
grid on
subplot(5,1,5);
plot(T,sfil);
title('demodulated signal filtered');
xlabel('time');
ylabel('amplitude');
grid onFirst changing of time:
What happens as you decrease the value of ‘T’:
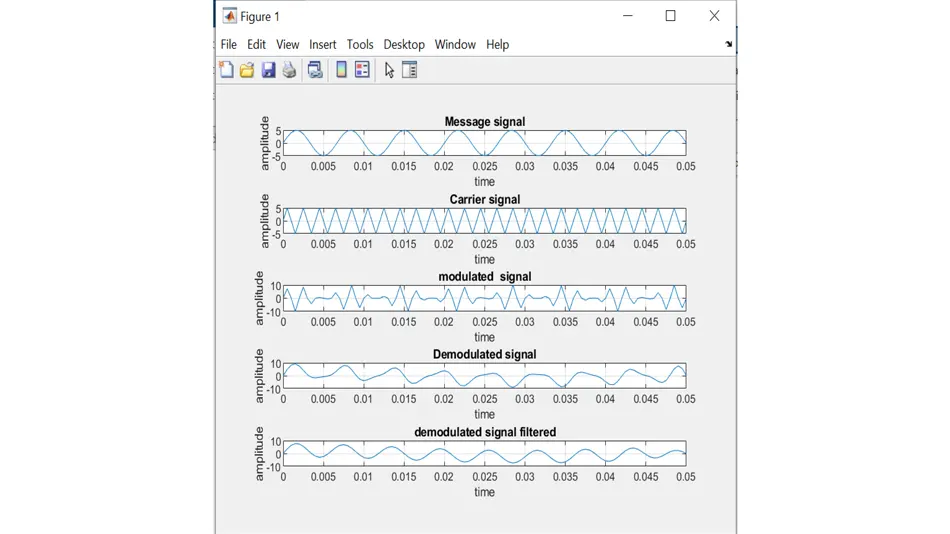
A given time is T=0:0.05:10. so we can say that the time here is 0 to 10 with a difference of 0.05. If we decrease the time to 1/10, 1/20, 1/30, 1/50, and 1/100, the length of the x-axis is reduced or we can simply say it’s zooming the given signals according to the x-axis (But must-see here the decreasing time produce an error of short interval occurs so that’s why we change the interval difference from 0.05 to 0.0005; by this, we see the different effects of time period on our signal as shown in following figures).
Changing value of time:
Time is 1/10:
Time is 1/20:
Time is 1/30:
Time is 1/50:
Time is 1/100:
2) What is the Role of ‘Fm’ in the above code? What would happen if we change the value of ‘Fm’? Try changing ‘Fm’ to 0.5, 1, 2, 5, and 10. Explain what happens as you increase the value of ‘Fm’?
Second changing in Fm:
What happens as you increase the value of ‘Fm’:
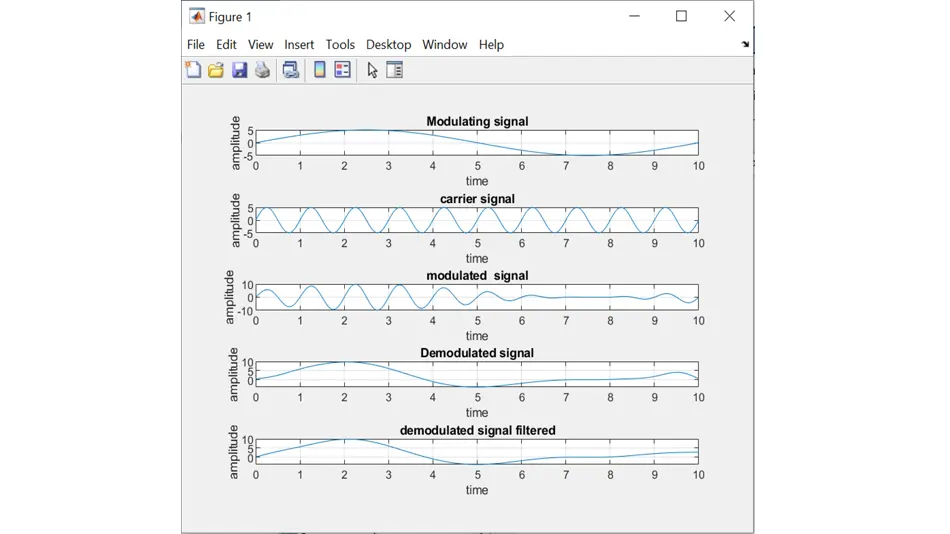
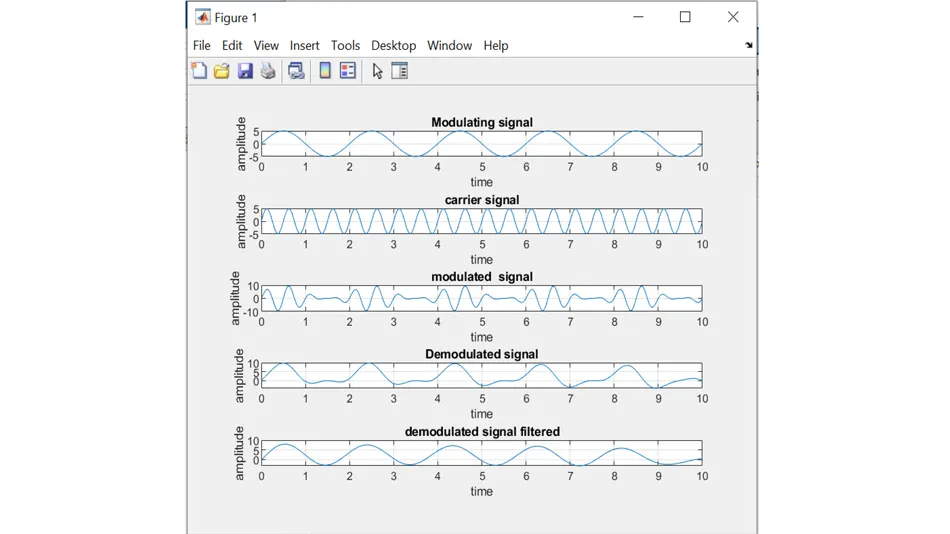
Changing of ‘Fm’ means we change the message signal frequency. So changing or here increasing the value of frequency in a given scenario will increase the frequency of message signal or wave. A value of ’10’ is noisy due to short intervals as seen in the following figures and due to this, it also affects the demodulation signal.
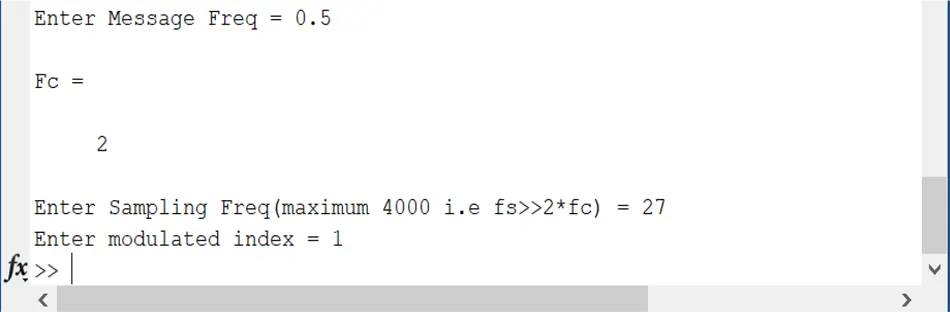
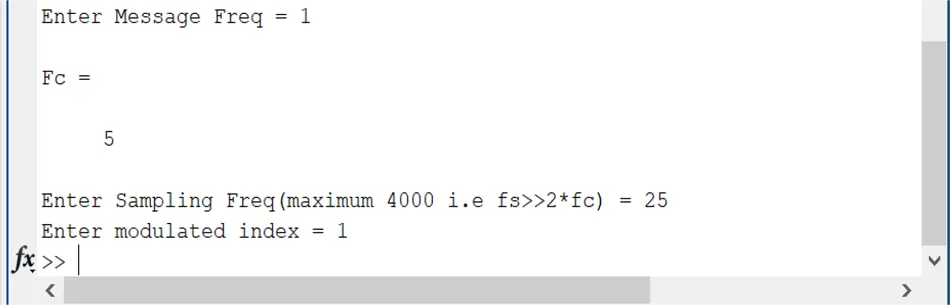
Here must remember that if the value of Fm is increasing in the 2nd part then you can double the Fc because the carrier signal is always greater than the message signal and also Fs>>2*Fc so that we easily recover or demodulate our message signal.
Changing value of Fm:
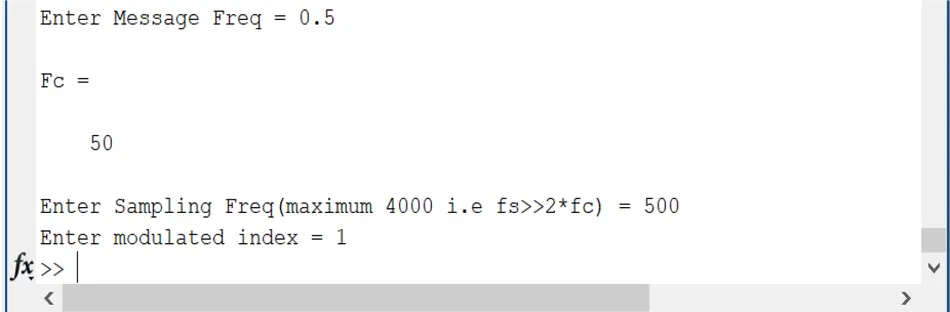
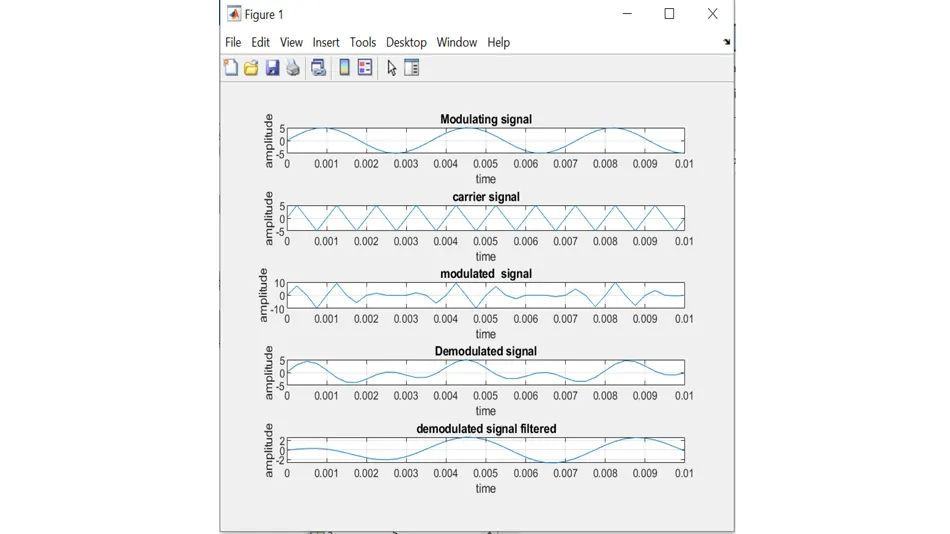
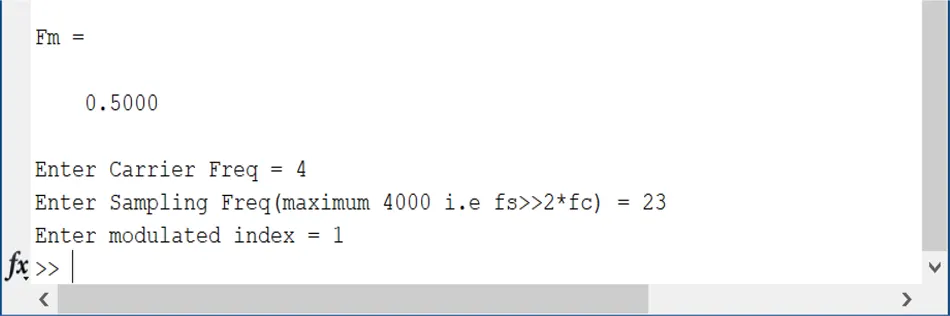
Fm = 0.5:
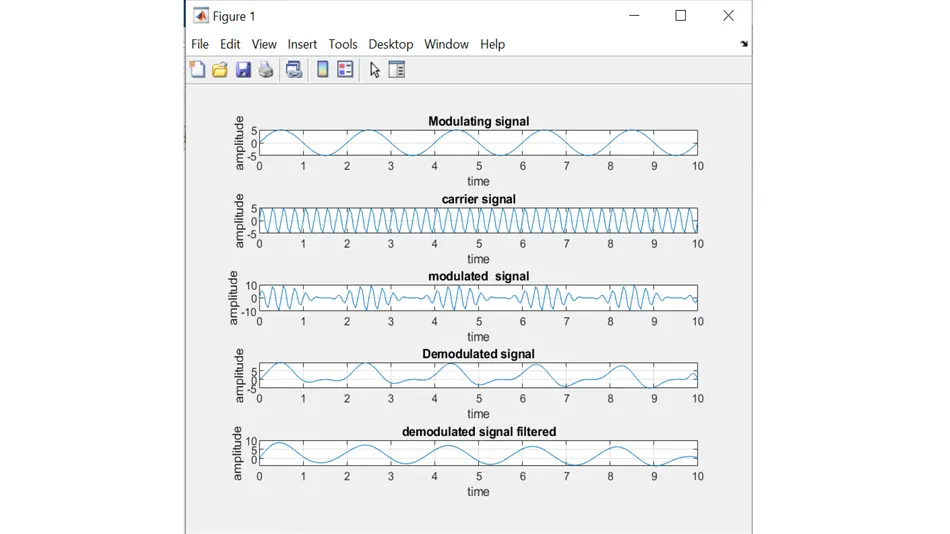
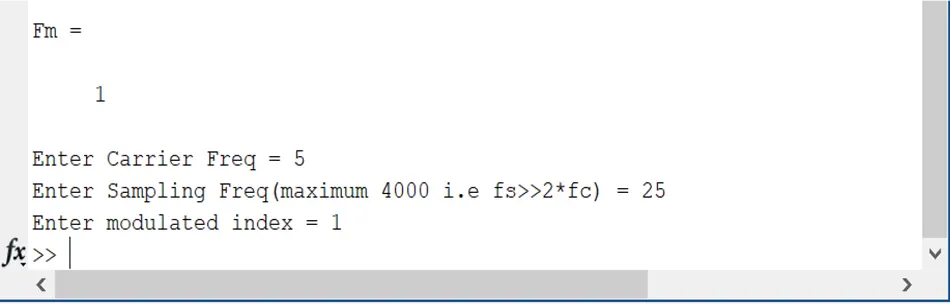
Fm = 1:
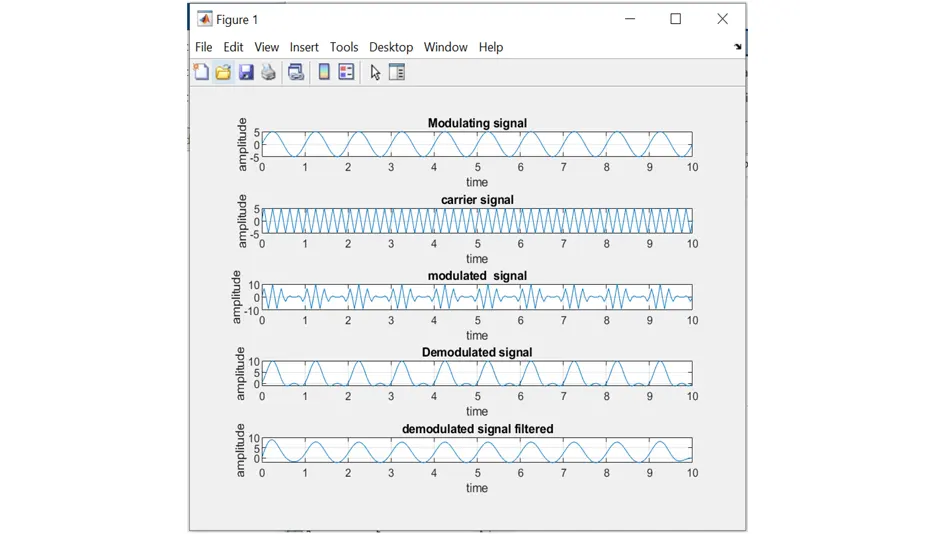
Fm = 2:
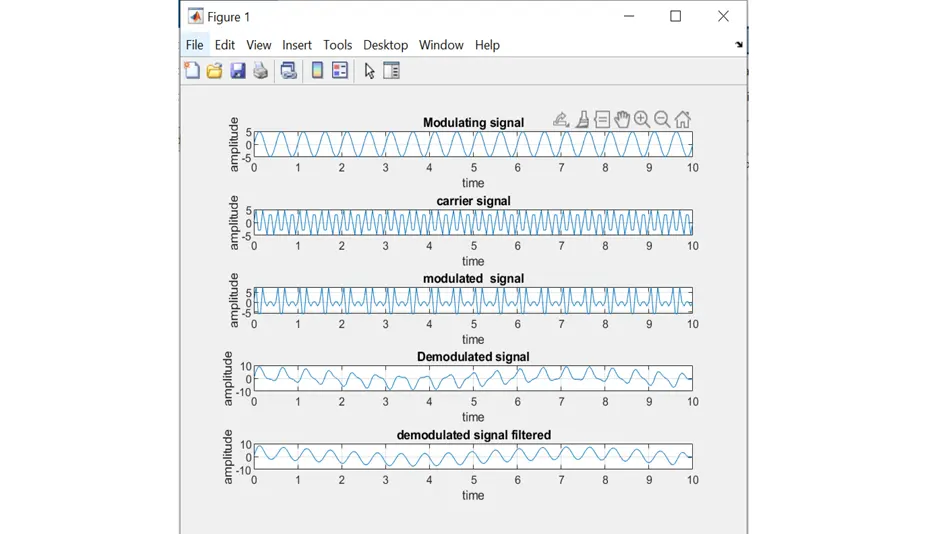
Fm = 5:
Fm = 10:
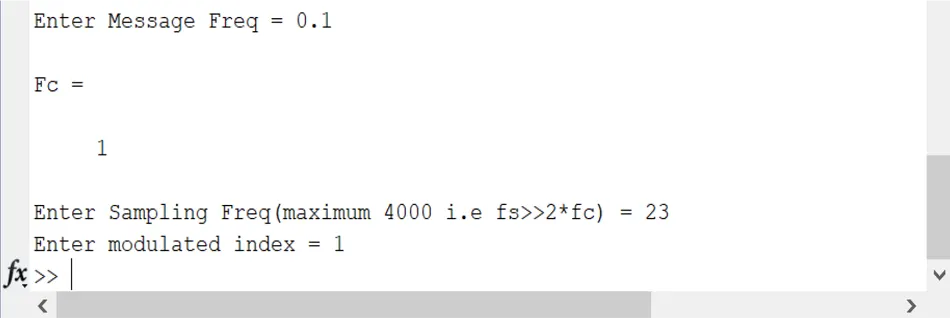
3) What is the Role of ‘Fc’ in the above code? What would happen if we change the value of ‘Fc’? Try changing ‘Fc’ to 1, 2, 5, 10, 20, 30, and 50. Explain what happens as you increase the value of ‘Fc’?
Third changing in Fc:
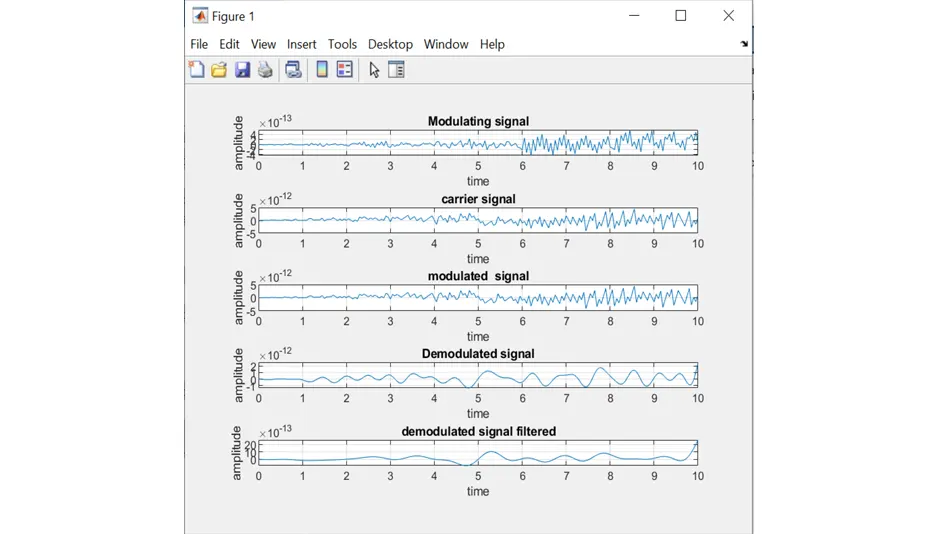
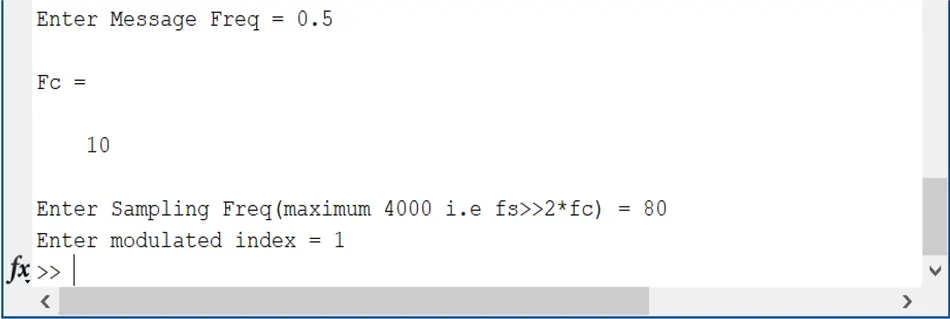
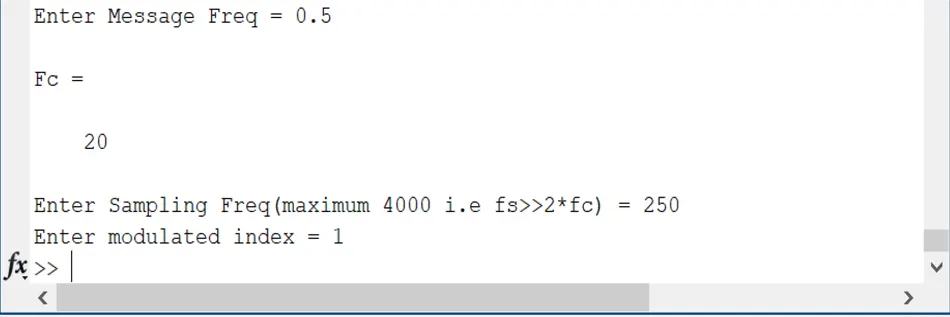
What happens as you increase the value of ‘Fc’:
Fc means carrier frequency, Increasing the ‘Fc’ as mentioned in a given scenario will increase the carrier signal frequency, and also, we can see in the following figure at values of 10, 20, 50, and 100 this carrier frequency is changed into noisy signal due to short interval of time and this noisy signal also affect the demodulated signal.
Changing value of Fc:
Fc = 1:
Fc = 2:
Fc = 5:
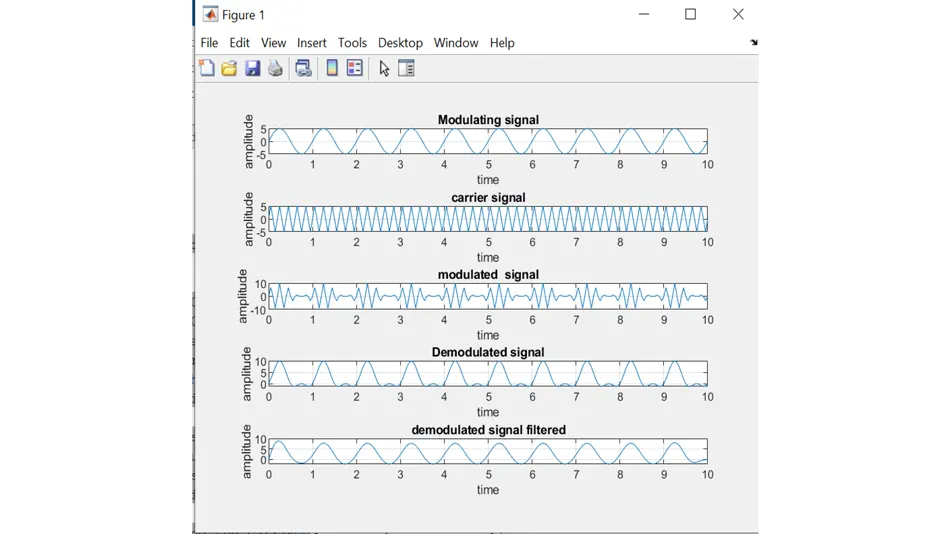
Fc = 10:
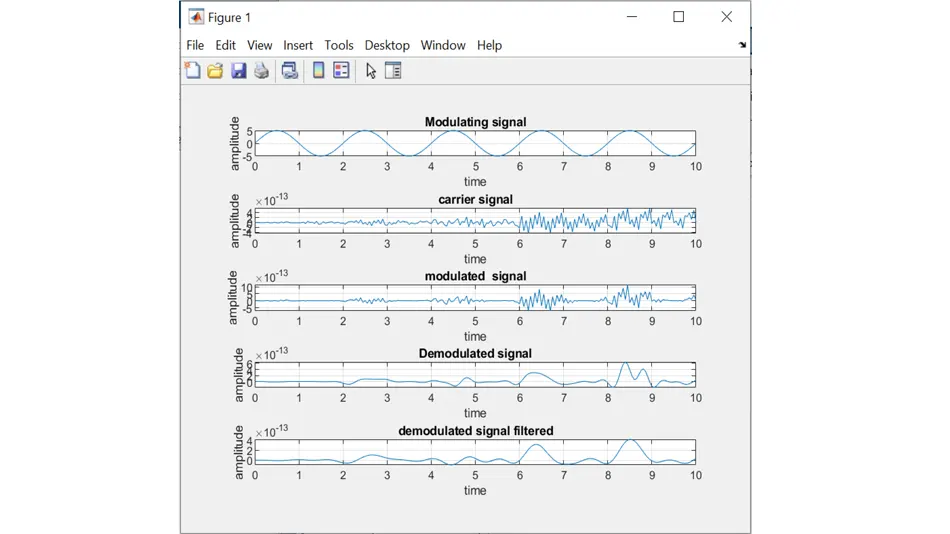
Fc = 20:
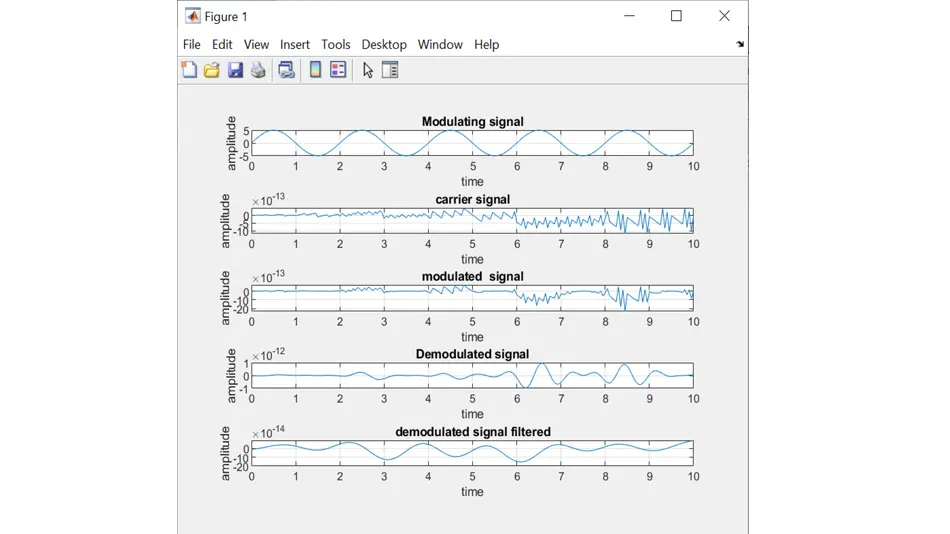
Fc = 30:
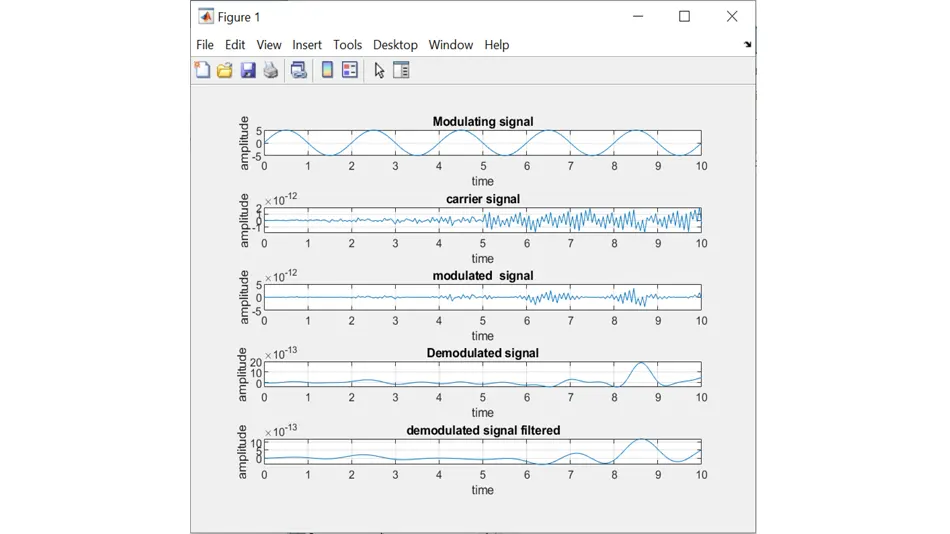
Fc = 50: